THE RESPONDENTS
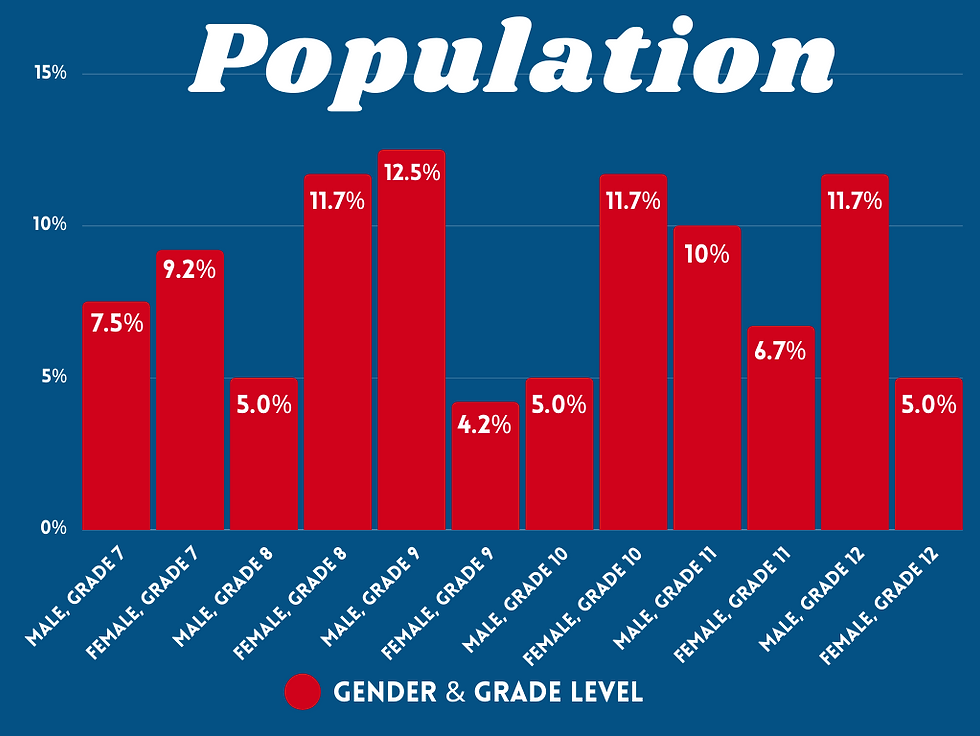
The Population graph indicates the population percentage of the students who participated in the project. There were a total of one-hundred twenty (120) respondents; twenty (20) randomly selected students answered from grades seven (7) to twelve (12). As shown from the graph above, a percentage of twelve point five (12.5%) or the majority are the male students from grade 9. This is then followed by three (3) eleven point seven percent (11.7%) from the female population of grades 8 and 10, and the male population of grade 12. Moreover, ten percent (10%) are male students of grade 11; nine point two percent (9.2%) are female students from grade 7; seven point five percent (7.5%) are grade 7 male students; six point seven percent are grade 11 female students. Furthermore, two (2) male and one (1) female populations are from the grade levels of 8, 10, and 12 which each has a percentage of five percent (5%). Lastly, the minority of the population or four point two percent (4.2%) are grade 9 female students.